Class 5 Cost Estimate: Order-of-Magnitude Using Cost Curves
The fastest estimate you can produce — and the one most likely to shape a billion-dollar decision. Learn how Class 5 power-law cost curves work, where they come from, and how to apply them with confidence.
How Kpex implements Class 5 following AACE 18R-97
Kpex 2G guides the cost engineer through every step of the Class 5 workflow — from scope input to indexed, location-adjusted output — enforcing the AACE recommended methodology at each stage. The platform validates inputs, applies the correct indices automatically, and generates a documented Basis of Estimate aligned with AACE 18R-97.
What Is a Class 5 Cost Estimate?
A Class 5 Order-of-Magnitude (OOM) estimate is the earliest cost signal in a project's lifecycle. Prepared when project definition is virtually non-existent (0–2% engineering complete), it answers a single strategic question: Is this project worth pursuing at all?
Per AACE International Recommended Practice 18R-97, Class 5 estimates carry an expected accuracy range of −50% to +100%. That wide band is not a weakness — it is an honest acknowledgement of how little is known at this stage. The value lies in speed and relative comparison, not in precision.
"The purpose of an order-of-magnitude estimate is not to be right — it is to avoid being catastrophically wrong."
— AACE InternationalThe Power-Law Cost Curve Method
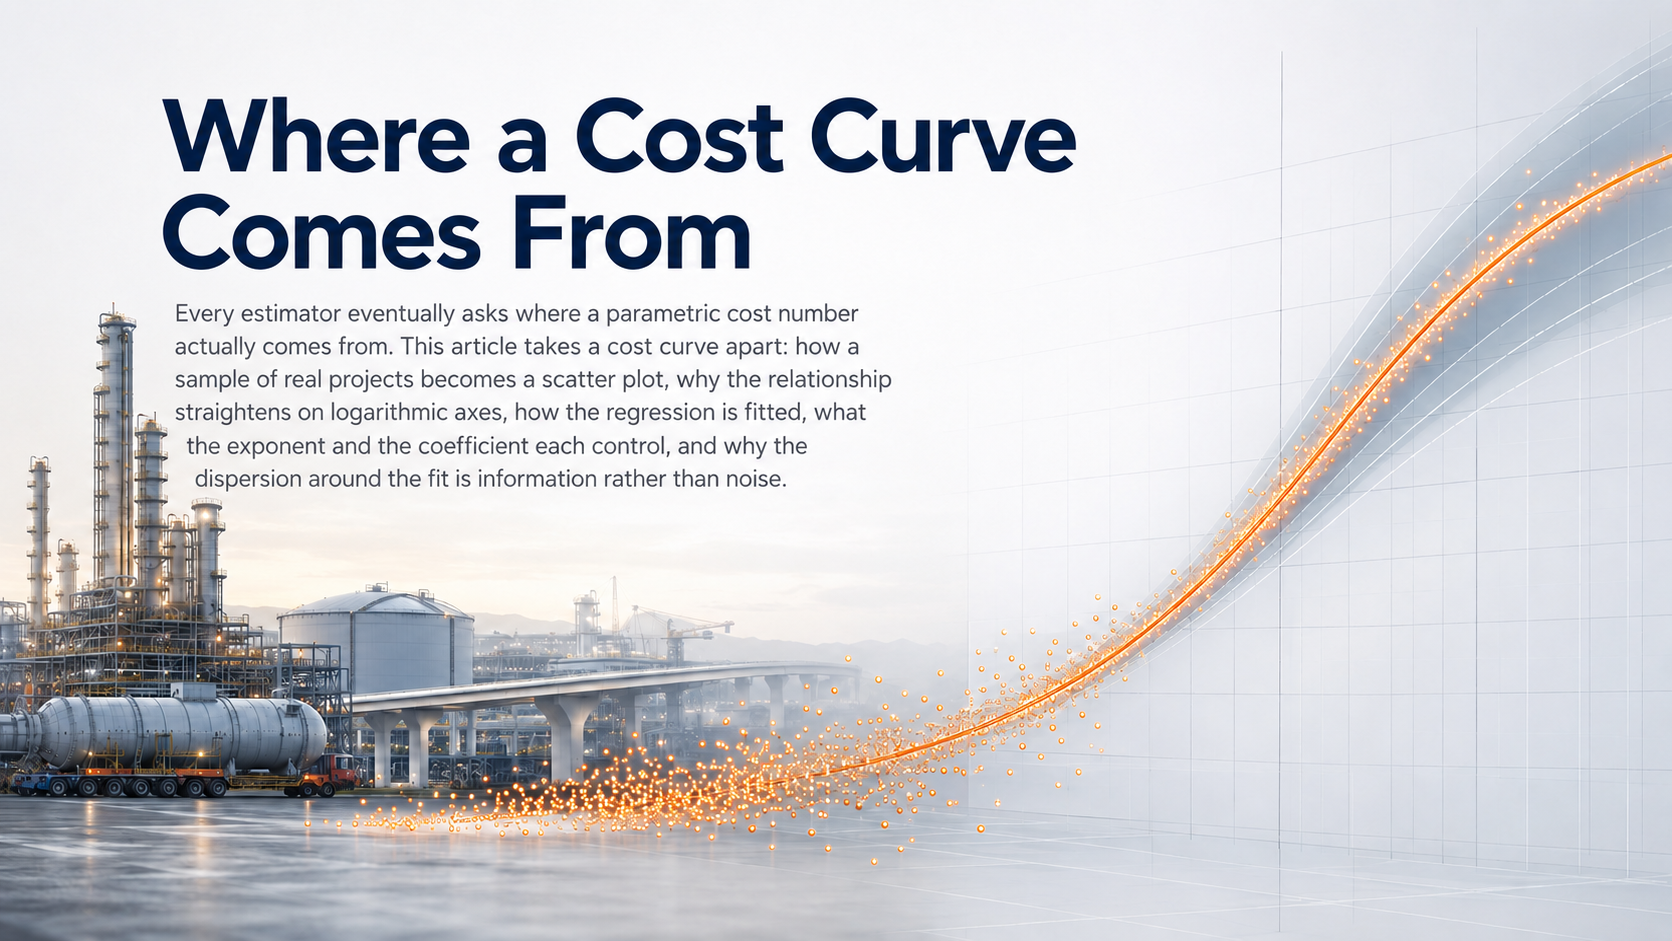
The mathematical backbone of Class 5 estimation is the power-law (six-tenths) cost curve:
Where:
- Costref — Historical cost of a reference plant at known capacity
- Capacity ratio — The sizing relationship (tonnage, MW, m³/h, bpd…)
- n — The scaling exponent, typically 0.6 for process plants (hence "six-tenths rule"), ranging 0.5–0.9 by industry
- KPEX — Proprietary Kpex methodology — adjusts for inflation between the reference year and current year
Class 5 Workflow — Step by Step
Step 1 — Define the Sizing Parameter
Choose the single capacity metric that best characterises your facility: feed rate (MMSCFD, bpd), output (MW, tonne/year), throughput (m³/h). This becomes the independent variable on your cost curve.
Step 2 — Select the Reference Cost Curve
From a validated cost database (such as Kpex Module C — Facilities Cost Models), retrieve the curve for your facility type: onshore oil & gas, chemical plant, solar PV farm, water treatment, etc. The curve provides Costref and n for your sector.
Step 3 — Apply the Capacity Ratio
Raise the capacity ratio to the power n. A plant twice the size does not cost twice as much — economies of scale mean cost grows at roughly 60–80% of the linear rate. This is the core insight of Class 5 estimation.
Step 4 — Apply the CEPCI/CAI Time Adjustment
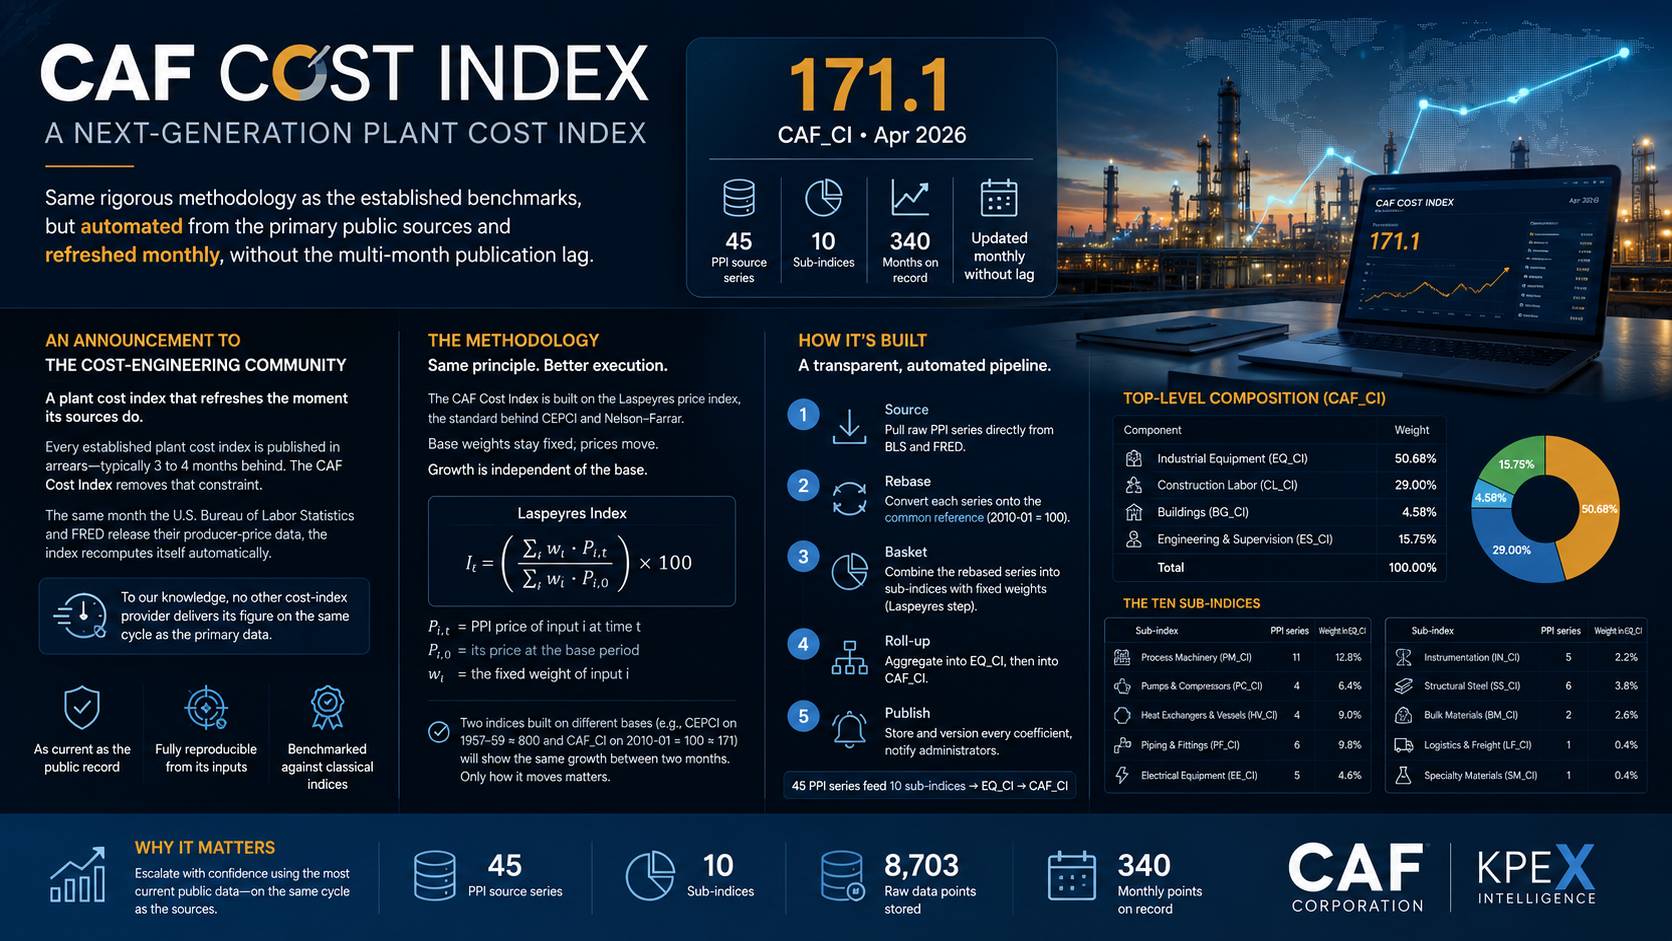
Historical reference costs must be escalated to current market conditions. The Proprietary Kpex methodology Plant Cost Index (KPEX) published monthly by Kpex Project Cost Intelligence Platform, is the standard reference. Kpex Module Z.5 (CAI) stores KPEX and ENR data from 1998 onward and applies the ratio automatically.
Step 5 — Apply the LFI Geographic Adjustment
A cost curve built on US Gulf Coast (USGC) data must be adjusted for your project's location. The Location Factor Index (LFI) — Kpex Module Z.4 — provides composite adjustment factors for 196 countries across Equipment, Civil, Labor, and Indirect cost categories.
Cost = 420 × (50,000/30,000)0.65 × (798/556) × 0.82 ≈ USD 680 M
Step 6 — Add Contingency
At Class 5, contingency typically runs 30–50% of the base estimate to reflect the high uncertainty in scope definition and market conditions.
Step 7 — Document the Basis of Estimate
Even at Class 5, a documented Basis of Estimate (BoE) is non-negotiable. Record: reference plant source, capacity units, scaling exponent, KPEX basis year, LFI country, contingency rationale, and all assumptions.
Key Inputs and Outputs
| Input | Source |
|---|---|
| Facility type & capacity | Project brief / feasibility study |
| Reference cost database | Kpex Module C / IHS Herold / In-house history |
| Current Kpex Cost Index value | Kpex Z.5 / Chemical Engineering magazine |
| Location factor | Kpex Z.4 (196 countries) |
| Scaling exponent (n) | Kpex curve library / IChemE / Peters & Timmerhaus |
Output: Single-point TIC (Total Installed Cost) with stated accuracy (−50% / +100%), basis of estimate document, and sensitivity band chart.
How Kpex Implements Class 5 — AACE 18R-97 Compliance
Kpex 2G automates the entire Class 5 workflow:
- Select your facility type from Module C (60+ facility types, 196 countries)
- Enter capacity — the platform applies the correct scaling exponent from the curve library
- KPEX escalation is applied automatically from Module Z.5
- Select your project country and Module Z.4 applies the composite LFI
- Output: TIC report with full basis of estimate, exportable to PDF
When to Use Class 5
- Portfolio screening — comparing 5 project options before committing to FEED
- Business case development for Board approval
- Early NPV sensitivity analysis
- M&A due diligence (quick-look valuation)
- Benchmarking proposed project against historical industry projects
Class 5 in Kpex — Step by Step in the Platform
- Create a new estimate → select Class 5 – Order of Magnitude. Kpex sets the AACE accuracy range (−50% / +100%) automatically.
- Select facility type from Module C (60+ types: onshore O&G, chemical plant, solar PV, water treatment…). The platform loads the correct cost curve and scaling exponent n.
- Enter the sizing parameter (capacity, throughput, MW…). Kpex applies the power-law formula and displays the reference base cost.
- Select project country → Module Z.4 applies the composite LFI automatically (equipment + civil + labor + indirect sub-indices).
- Set cost basis year and target year → Module Z.5 fetches the KPEX ratio and escalates the base cost to current market conditions.
- Review TIC output and contingency. Kpex proposes a default Class 5 contingency band; the engineer may override with a risk-justified value.
- Generate Basis of Estimate report — the PDF includes all input parameters, indices applied, curve reference, and AACE class declaration.
AACE References
- AACE 18R-97 — Cost Estimate Classification System (Process Industries)
- AACE 59R-10 — Development of Factored Cost Estimates
- AACE 16R-90 — Conducting Technical and Economic Evaluations
- Peters, Timmerhaus & West — Plant Design and Economics for Chemical Engineers (6th Ed.)