The Kpex Cost Index
A next-generation plant cost index — same rigorous methodology as the established benchmarks, but automated from the primary public sources and refreshed monthly, without the multi-month publication lag.
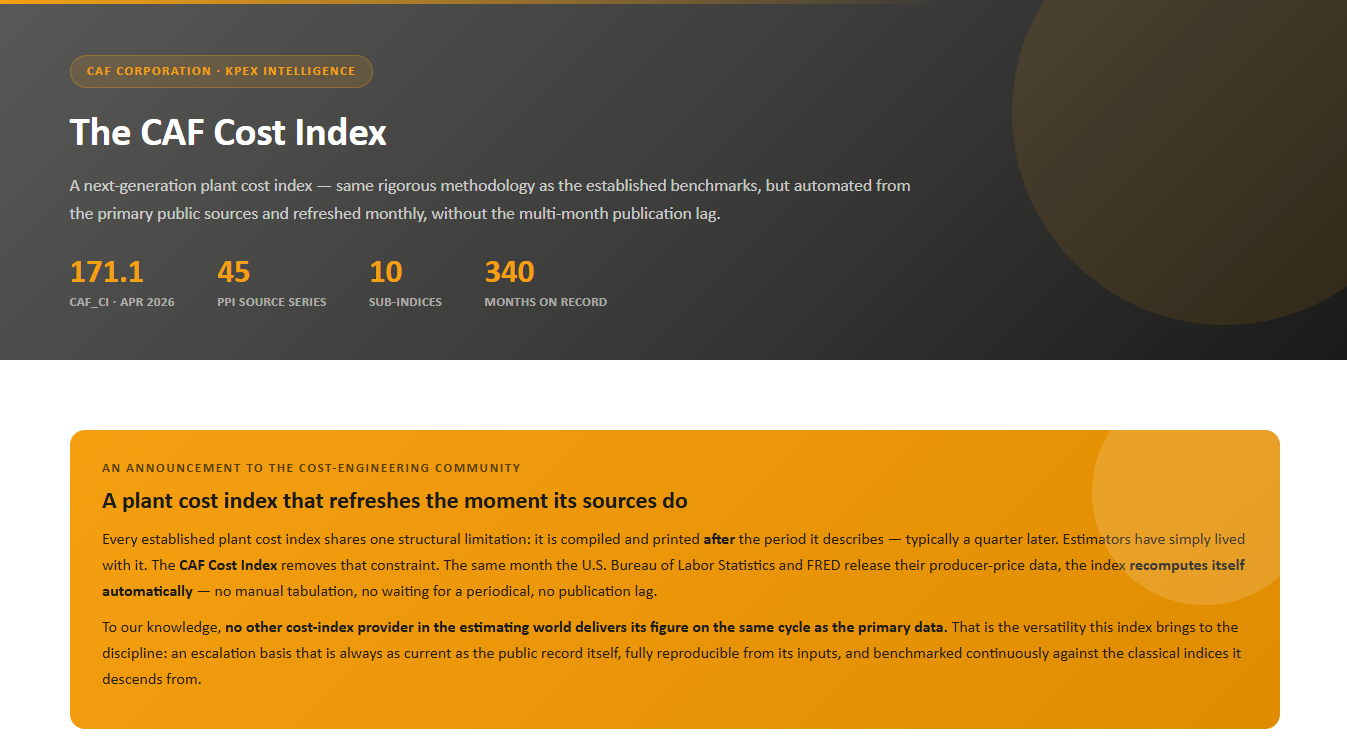
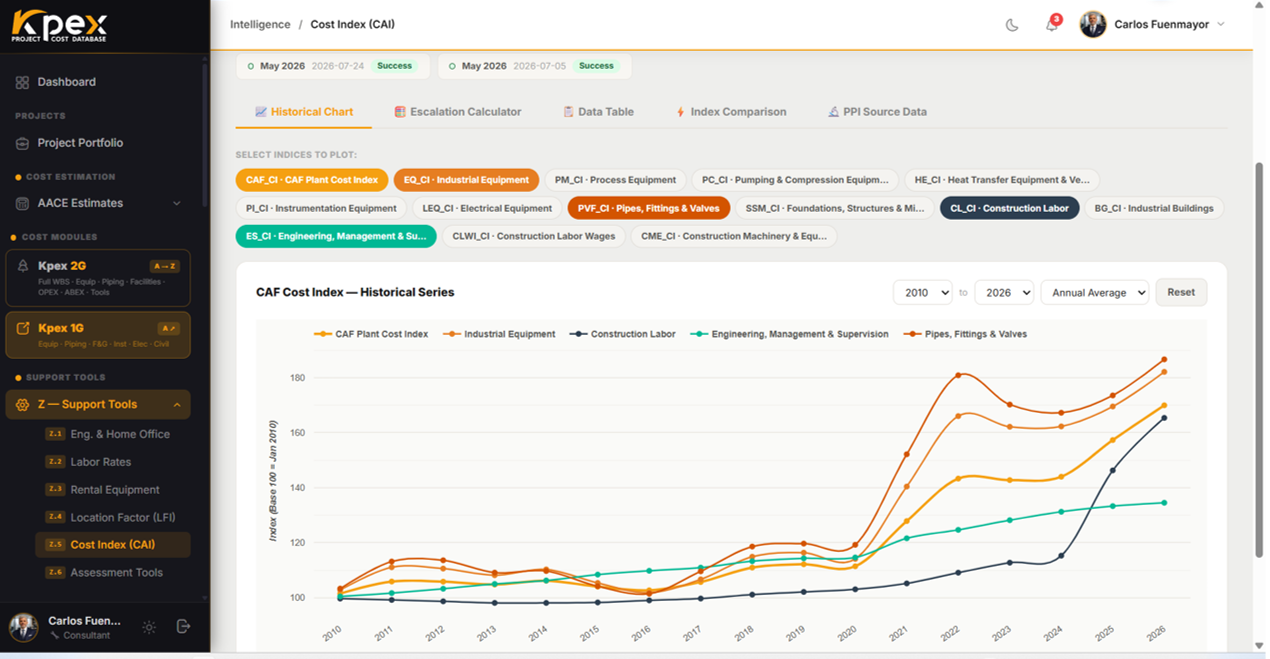
For half a century, every serious plant cost index has shared one quiet limitation: it tells you what things cost last quarter. Escalation — the step that carries a historical price to today — has been built on numbers that are, by design, already months old. The CAF Cost Index was built to close that gap.
The same month the U.S. Bureau of Labor Statistics and FRED release their producer-price data, the CAF Cost Index recomputes itself — automatically, with no manual tabulation and no publication lag. To our knowledge, no other cost-index provider in the estimating world delivers its figure on the same cycle as the primary data.
The problem every cost index shares
CEPCI, Nelson–Farrar and their peers are trusted for good reason: each is a carefully weighted basket of published producer prices, and estimators have leaned on them for decades. But they share one structural weakness — they are published in arrears, typically three to four months behind the period they describe. An estimate escalated today is escalated to a number that is already a quarter old, and that staleness quietly propagates into every figure that follows.
A recognized method — named
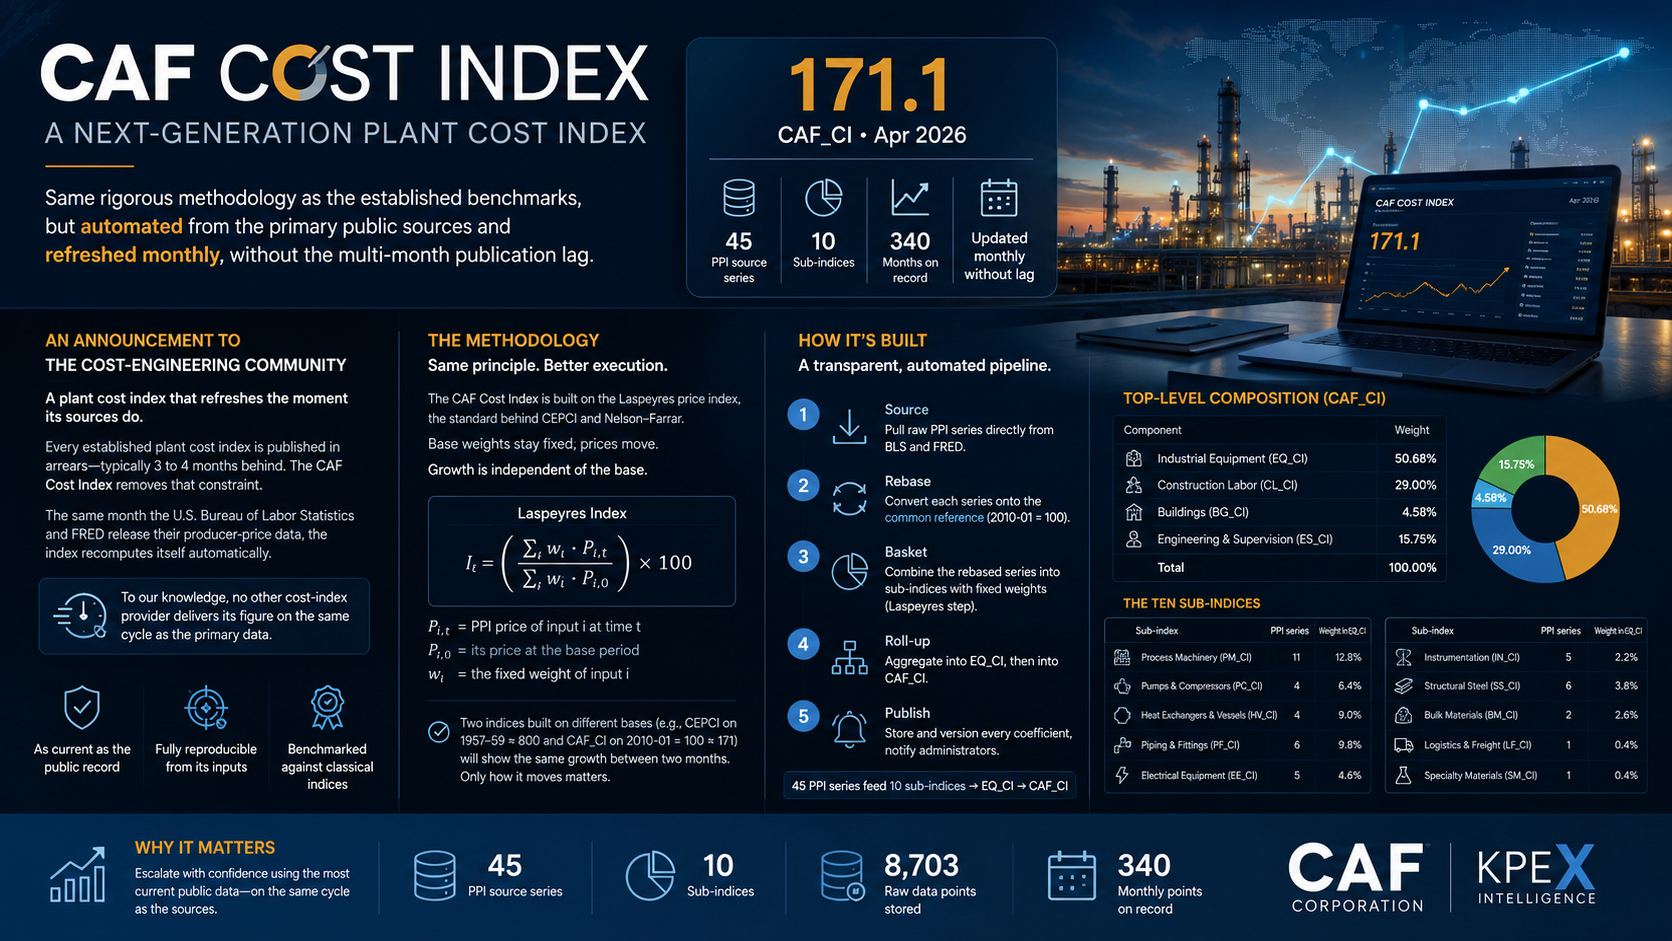
The CAF Cost Index is not a departure from accepted practice; it is a continuation of it. CEPCI, Nelson–Farrar and the CAF Index all belong to the same family: a weighted Laspeyres index over baskets of Producer Price Index (PPI) series, rebased to a common reference period. The differences between them are choices of which series, what weights, and — decisively — how current the inputs are.
The Laspeyres construction fixes the basket (the weights) at a base period and lets only the prices move. A useful property falls out of that: because the weights and the base prices are constants, the ratio of the index between any two dates — which is all escalation actually uses — depends only on how the underlying prices moved, not on the base. Two indices sitting on entirely different scales (CEPCI near 800; the CAF Index near 170) will therefore show the same growth between two dates, provided they track the same underlying prices. The absolute level never matters; only how the index moves.
Current by construction
What changes with the CAF Cost Index is the pipeline. Instead of waiting for a periodical to compile and print, it pulls its inputs directly from the primary public sources and assembles the index the same month the data lands:
- Source — raw PPI series pulled directly from BLS and FRED.
- Rebase — each series converted onto a common reference period.
- Basket — the rebased series combined into a sub-index with fixed weights (the Laspeyres step).
- Roll-up — equipment sub-indices aggregate into an industrial-equipment index, then into the composite CAF Cost Index alongside construction labor, buildings and engineering.
- Publish — every coefficient stored and versioned, and administrators notified the moment the series moves.
Does it hold up? The CAF Index against CEPCI
A new index is only credible if it reproduces the economic reality the established benchmarks already measure. So we tested it directly: take the CAF Cost Index and CEPCI over the same span and compare not their levels — which sit on different bases and cannot be compared directly — but their growth, the quantity escalation depends on.
It holds. Over the settled period 2011–2024, the annual growth of the two indices moves in the same direction in 13 of 14 years, and the two growth series correlate at a Pearson r of 0.995 — near-identical — despite their completely different absolute scales.
| Year | CEPCI growth (YoY) | CAF Index growth (YoY) | Same direction |
|---|---|---|---|
| 2011 | +6.0% | +4.3% | ✓ |
| 2012 | −0.2% | −0.0% | ✓ |
| 2013 | −3.0% | −1.0% | ✓ |
| 2014 | +1.5% | +1.3% | ✓ |
| 2015 | −3.3% | −2.0% | ✓ |
| 2016 | −2.7% | −1.3% | ✓ |
| 2017 | +4.8% | +2.9% | ✓ |
| 2018 | +6.2% | +5.0% | ✓ |
| 2019 | +0.8% | +1.1% | ✓ |
| 2020 | −1.9% | −0.7% | ✓ |
| 2021 | +18.8% | +14.8% | ✓ |
| 2022 | +15.3% | +12.1% | ✓ |
| 2023 | −2.3% | −0.4% | ✓ |
| 2024 | −0.2% | +0.9% | ≈ (both flat) |
Validation study — annual averages. CAF Cost Index computed by Kpex from BLS/FRED producer-price series; CEPCI from its published monthly values. The comparison is run on growth rates precisely because the two indices sit on different base periods; the small, consistent gap reflects CAF’s refined series selection and modern weighting, not a difference in method.
Why it matters for your estimate
Escalation is not a footnote — it moves the whole number. Escalating to an index that is a quarter stale bakes that staleness into every figure that follows it. A monthly, source-current index means the escalation basis is as recent as the public data itself, and it moves the same month the market does — while remaining fully reproducible from its inputs and benchmarked continuously against the classical indices it descends from.
The CAF Cost Index is the launch of a next-generation cost index: the discipline of the classical method, delivered with the timeliness that only direct automation from the primary source can provide. Same economics, same methodological DNA — sourced live.